Fake News Detection on Social Media using Geometric Deep Learning
09 Dec 2021 | geometricdeeplearning graphneuralnetwork fakenewsdetection gdl gnnThis blog will summarize & discuss the paper by Monti et al. titled Fake News Detection on Social Media using Geometric Deep Learning linked here.
This paper proposes an approach to detect fake news based on its propagation patterns by using geometric deep learning, a novel class of deep learning methods designed to work on graph-structured data.
In this blog, we will go through the key concepts of this paper, with the following outline:
- Overview of Fake News Detection
- Prior Works
- Main Contribution
- Dataset Descriptions
- Extracted features
- Twitter users credibility and network polarization
- Overview of Geometric Deep Learning
- Graph Neural Network (GNN) / Graph CNN
- Model Architecture
- Input Processing
- Results
- Training Summary
- Model Performance
- Ablation Study
- Importance of News Spreading Time
- Model Aging
- Conclusion
Overview of Fake News Detection
 (Image Credit: author)
Nowadays social media has become one of the primary sources of news for people all around the world, as it offers low cost and easy access for many. However, this also means that people are more vulnerable to exposure to fake news containing poorly checked or even intentionally false information aimed at misleading and manipulating the readers to pursue certain political and economic agendas.
The spread of false information is a real threat to modern democracies, as have been observed to be affecting the United States 2016 presidential elections and the Brexit vote in the United Kingdom. Due to the very high societal and economical cost of the phenomenon, a lot of work has been done in this realm, both in academia and industry.
Challenges present in this field of research include the need of political and social context knowledge for content-based fake news analysis, which could be very nuanced and thus very hard to automate using Natural Language Processing (NLP). This paper provides a model for automatic fake news detection using the novel approach of Geometric Deep Learning (which we will go into in a later section of the blog).
Prior Works
Existing approaches for fake news detection can be divided into three main categories, based on content, social context, and propagation.
Content-based approaches rely on linguistic (lexical and syntactical) features to detect fake news, generally done using NLP. However, fake news these days could be written linguistically sophisticated manner, thus defying this approach. Furthermore, most linguistic features are language-dependent, thus limiting the generality of these approaches.
Context-based approaches take into account the demographics, reactions, and interaction between the audience of the news.
Propagation-based appraches look at news spread or proliferation process over time. Researchers have argued that that fake news propagate differently than factual news. This fact can be utilized in automatic fake news detection. This approach is content-agnostic and language-independent, thus can be highly generalizable.
News propagation can be naturally modeled using graph data structures, and it has been analyzed as such. However, prior works have focused on applying classical ‘handcrafted’ graph theoretical features such as centrality, cliques, or connected components. These are arguably rather arbitrary and too general for the specific task of fake news detection.
By using Geometric Deep Learning (specifically Graph CNN), the model proposed in this paper tries to unify the three approaches of fake news detection (content, context, and propagation based), to perform the task of fake news detection in an accurate and efficient manner. Using Geometric Deep Learning not only allows the model to encode the classical features of the graph nodes and edges, but also preserves the additional inductive bias we have in terms of the structure of the graph itself.
Main Contribution
The model proposed in this paper is trained in a supervised manner on a large set of annotated fake and factual stories spread on Twitter in the period of 2013 - 2018. Extensive testing of the model presents high accuracy (nearly 93% ROC AUC), requires very short news spread times (just a few hours of propagation), and performs well when the model is trained on data distant in time from testing data; thus generalizable for future news propagations.
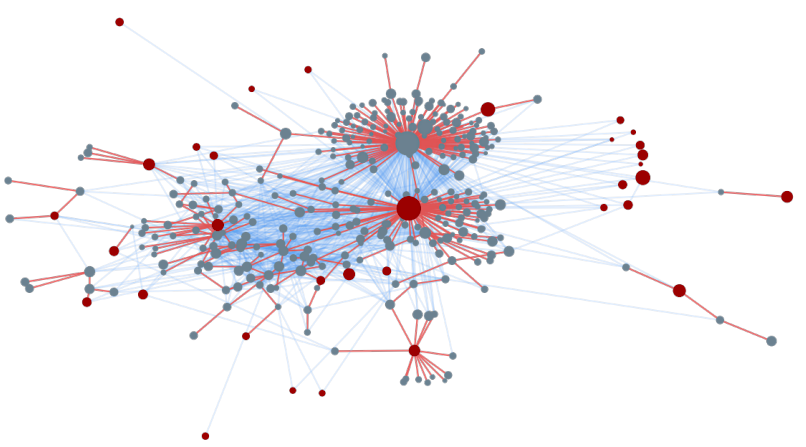 Figure 1: The spread of a single news story on a subset of the Twitter platform. The light-blue edges present social connections between users. The red nodes visualize the Twitter accounts that tweet the news URL, and thus are the cascade roots of the news propagation. The red edges present the retweets of the news URL tweets, which we’ll refer to as cascades. Some cascades are small, containing only the root (the tweeting user) or just a few retweets. Circle size represents the number of followers. (Monti et al 2019)
Dataset Descriptions
Many studies pertaining to fake news detection exploit the notion of reliable or unreliable news sources as a proxy for fake or factual news stories, an approach that has been criticized as too crude. Instead, the authors of this paper decide to verify each story individually using fact-checking organizations such as Snopes, Politifact, and Buzzfeed. Furthermore, the authors define the term fake news as both misinformation and disinformation (i.e. both unintentional and deliberate spread of misleading or wrong narrative).
Data collection process:
- gather articles from fact-checking organizations with labels of true or false.
- for each article, identify related news URLs.
- manually inspect each URL by looking at its full associated story and assign the labels of each URL based on whether they match or deny the associated claim (e.g. URLs matching a true claim are labeled as true, URLs denying a true claim are labeled as false).
- for each URL, extract its propagation cascade from Twitter, and enrich the graph representations (such as number of followers and retweets), resulting in graphs like the one in Figure 1 above.
Overall, this data collection process yields 202,375 nodes (Twitter accounts), 2,443,996 edges, and 1,129 URLs. Furthermore, a large proportion of cascades have on average 2.79 tweets and users.
Extracted Features:
- For user profile: geolocation, profile settings, language, word embedding of user profile self-description, date of account creation, and whether the accountis verified.
- For user activity: number of favorites, lists, and statuses.
- For network and spreading: social connections between the users, number of followers, cascade spreading tree, retweet timestamps and source device, number of replies, quotes, favorites and retweets for the source tweet.
- For content: word embedding of tweet textual content and included hashtags.
Next, let’s look at users’ network and their polarization based on the credibility of news they (re)tweeted.
Twitter users credibility and network polarization
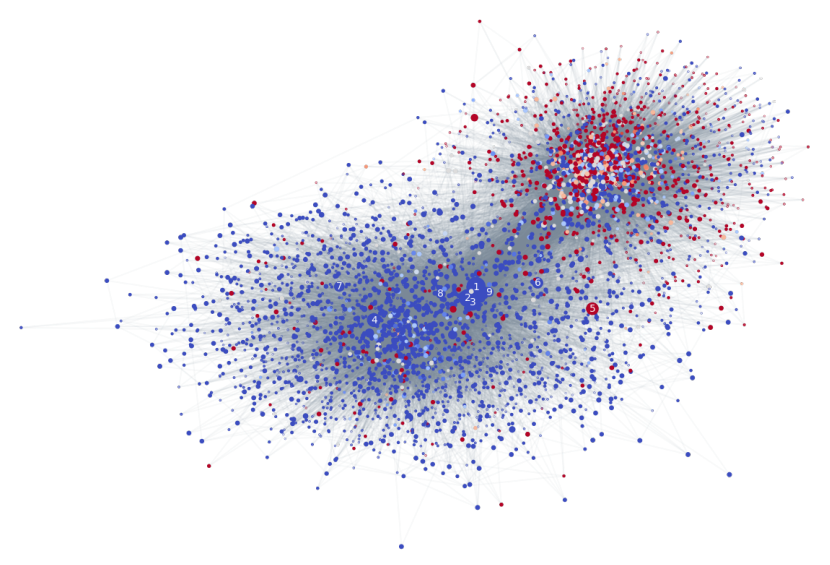 Figure 2: Subset of the Twitter network used in this study with estimated user credibility. Vertices represent users, gray edges the social connections between them. Vertex color encodes the user credibility (blue=reliable, red=unreliable) computed as the difference between the proportion of (re)tweeted true and fake news. Vertex size represents number of followers. Numbers 1 to 9 represent the nine users with most followers. Vertices are positioned such that those that are strongly connected are closer together while those that have weak connections are further apart. (Monti et al 2019)
From the graph above, we can observe that reliable (blue) and unreliable (red) users tend to form two distinct communities, suggesting that these two types of tweeters mainly only interact with those that are similar to them (homophilic interactions). Further study is needed to fully explain this phenomenon in more depth, but we could propose that this might be related to the reasons for the differences in fake and true news propagation patterns.
Now that we have some ideas about the dataset in this paper, let’s look at the concepts behind the model being used and how the dataset is utilized.
Overview of Geometric Deep Learning
First, let’s review some key concepts of geometric deep learning.
 (Image credit: Bronstein et al. from his blog)
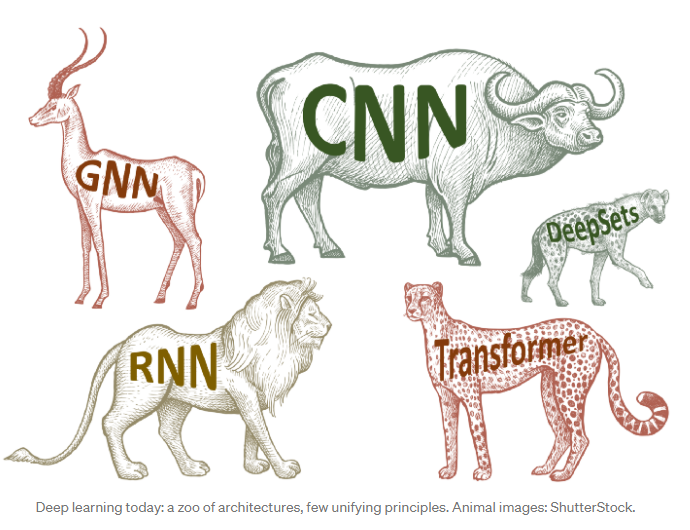
Deep Neural Networks (DNNs) in general have enabled us to tackle complex problems in computer vision, natural language processing, speech recognitions, and other fields that had been previously out of reach. This, however, leads to a ‘zoo’ of DNN architectures, leading to reinvention/rebranding of the same concepts. Furthermore, most popular DNN models are based on the assumption of Euclidean (grid-structured) space.
Geometric Deep Learning is an umbrella term for techniques to generalize DNN models to non-Euclidean domains such as graphs and manifolds (Bronstein et al.)). This is important when we have structurally complex input (such as graphs), because it allows us to preserve relational information instead of breaking it down to some arbitrary representation in Euclidean domains.
For a complete study on Geometric Deep Learning, please refer to this very extensive work by Bronstein et al.
Graph Neural Network (GNN) / Graph CNN
Recall that graph is a type of data structure that consists of nodes that are connected with edges based on some relationship between pairs of nodes. This data structure is a powerful modelling tool, since it allows us to not only represent features of entities represented as nodes, but also represent their potentially complex relationships using graph edges, thus acting as an additional inductive bias. Graph data structures are useful in modelling various entities and networks, including news propagation which is what we are interested in.
In Graph Neural Network (GNN), in the initial representation of an input graph G, the nodes (and potentially the edges) have specific embeddings to encode features of the input. We then hope to learn embeddings for each node that encode the information of how each of those nodes belong in the context of its neighborhood within the graph and the graph structure itself. Such process of learning embedding for a node can be done using neural message passing with permutation-invariant operator (such as sum, max, min, etc.), for example. This enriched representation of graph G can then be used in specific tasks, such as node, edge, or graph classification. In our case, this task is of graph classification as we classify a news URL to be either fake or real, based on a graph of its propagation.
In summary, GNNs are an effort to apply deep learning tehcniques to graph inputs. The term GNN itself refers to various architectures used to deal with graph input, with the same basic idea of graph convolution, where we extend the classical convolutional operations (i.e. CNNs) with a local permutation-invariant aggregation on the neighborhood of a vertex in a graph. The term Graph CNN in this paper refers to this underlying shared idea.
Model Architecture
The authors used a four-layer Graph CNN with two convolutional layers and two fully-connected layers, to predict the fake/tru class probabilities for each input (URL). One head of graph attention was used in every convolutional layer to implement the filters together with mean-pooling for dimensionality reduction. The non-linearity used is Scaled Exponential Linear Unit (SELU). Hinge Loss was employed (since it outperformed mean cross entropy). No regularization was used.
Block diagram of the model:
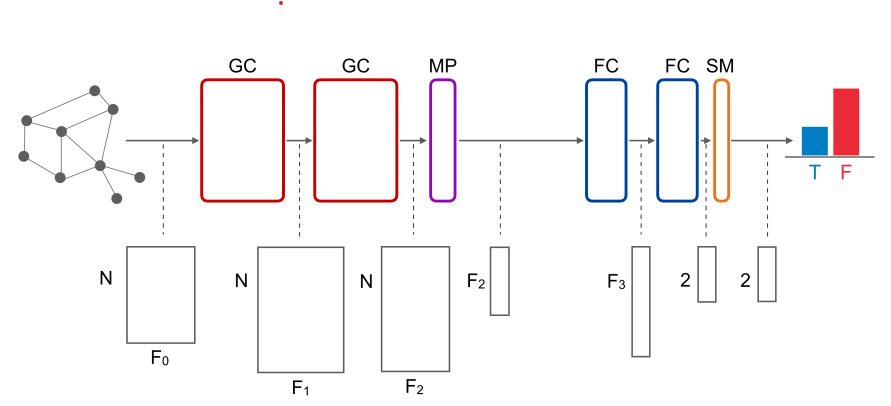 Figure 3: The architecture of the neural network model in this paper. Top row: GC = Graph Convolution, MP = Mean Pooling, FC = Fully Connected, SM = Softmax Layer. Bottom row: input/output tensors received/produced by each layer. (Monti et al 2019)
Input Processing
The input to the model is a graph $G_u$, representing a URL $ u $ and its propagation by tweets and retweets. The nodes of the graphs represent the tweets mentioning the URL $u$, with features as listed above, under the Extracted Features subtitle. Given two nodes $i$ and $j$, the edge $(i,j) \in G_u$ if and only if one of the following conditions hold: the author of tweet $i$ follows the author of tweet $j$ or vice versa, the news spreads from $i$ to $j$ or from $j$ to $i$. The features of each of the edges represent which of the mentioned conditions is/are met by the edge.
The authors’ approach to defining graph connectivity and edge features allows, in graph convolution, to spread information independently of the relation direction while potentially giving different importance to the types of connections.
Result
Monti et al. (the authors) considered two different settings of fake news detection, using the same setting for both, as follows:
- URL-based detection: prediction of true/fake label of a URL is done based on all the Twitter cascades (spreading network due to retweets). On average, each URL resulted in ~141 cascades.
- cascade-based detection: prediction of true/fake label of a URL based on only one cascade arising from that URL – which makes this setting significantly more challenging. The authors’ assumption is that all the cascades associated with a URL inherit the label of the URL. This assumption is mostly true, but there might be some cases where an URL is retweeted with accompanying text refuting the URL. This extended analysis is left as a future research direction.
Training Summary
The authors used 5 randomized training/validation/testing splits, containing on average 677, 226, 226 URLs respectively, with 83.26% true and 16.74% false labels. Full cascade duration (24 hours) was used for both settings of the experiment, and cascades containing less than 6 tweets were discarded. The training, validation, and test sets contained on average 3586, 1195, 1195 cascades respectively, with 81.73% true and 18.27% false labels.
Only cascades containing at least 6 tweets were included, as this cutting-point yields the best performing model, as measured by its ROC AUC.
The network was trained for $25 \times 10^3$ and $50 \times 10^3$ iterations in the URL- and cascade-wise settings respectively, using AMSGrad (from this paper) with learning rate $5 \times 10^{-4}$ and mini-batch of size 1.
Model Performance
Performance summary, in graph:
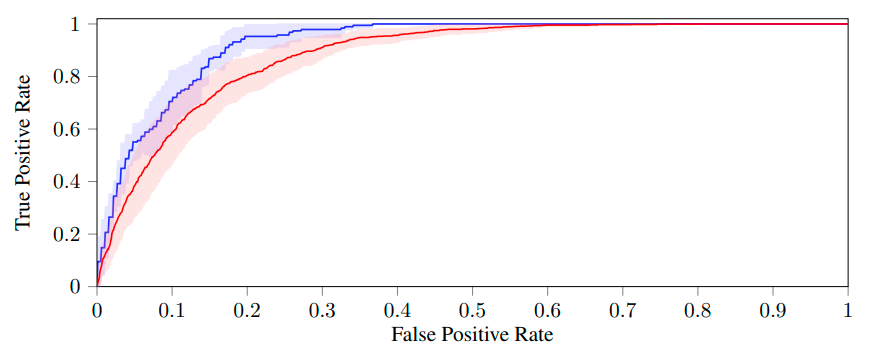 Figure 4: Performance of URL-wise (blue) and cascade-wise (red) fake news detection using 24hr-long diffusion time. Shown are ROC curves averaged on five folds (the shaded areas represent the standard deviations). ROC AUC is $92.70 \pm 1.80%$ for URL-wise classification and $88.30 \pm 2.74%$ for cascade-wise classification. (Monti et al 2019)
Ablation Study
The authors performed ablation study to further highlight the importance of the features provided as input to the model, by means of backward-feature selection. This is done by removing a certain feature at a time, to understand the contribution/importance of that feature. The considered features (as listed under the Extracted Features subtitle): user profile, user activity, network and spreading, and content.
In both URL- and cascade-wise settings, user-profile and network/spreading appear as the two most important feature groups, yielding almost 90% ROC AUC.
In the cascade-wise setting, the authors decided to completely ignore content feature (tweet word embeddings) and let the model exploit only user- and propagation-related features. This is because including the content feature leads to slight overfitting (which in fact could also be dealt with by introducing regularizations).
Ablation study result, in graph:
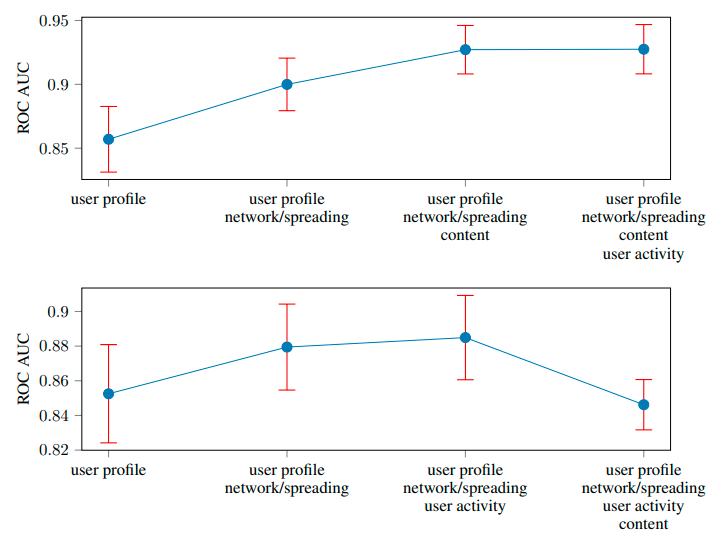 Figure 5: Ablation study result on URL-wise (top) / cascade-wise (bottom) fake news detection, using backward feature selection. Groups are sorted for importance from left to right. (Monti et al 2019)
Importance of News Spreading Time
For how much time do the news have to spread before we can classify them reliably?
To answer this question, the authors built and trained models using cascades that were formed after 0, 1, …, 24 hours; and compared their ROC AUC scores.
Performance summary in graph, for cascades with varied durations:
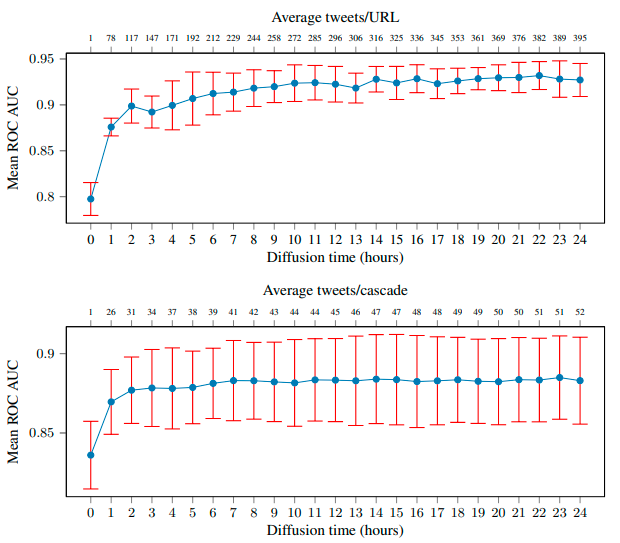 Figure 6: Model performance increases with the cascade duration, saturating roughly after 15 hours in the URL-wise setting, and 7 hours in cascade-wise setting. Note that just ~2 hours of news spread is sufficient to achieve >90% ROC AUC in URL-wise setting. Significant jump in performance from the 0hr setting (thus not using spread feature) to 1hr settings (spread is considered) could be a signal of the importance of propagation-related features. (Monti et al 2019)
Model Aging
To what extent can a model trained in the past generalize to new circumstances?
The proposed model exhibits a slight deterioration in performance only after 180 days (~6 months) for the URL-wise setting. This could be because after this amount of time, user activity profiles and spreadin patterns could show significant changes.
The model performance in the cascade-wise setting proves to be more robust, as it loses 0.4 of its ROC AUC only after 260 days (~8.7 months).
This different behavior is likely due to different size and complication of the input graphs in both settings, which leads the model to learn different features / structures in URL- and cascade-settings. These set of features could then have different robustness to aging.
Conclusion
Geometric Deep Learning allows us to utilize all aspects of our data (input) as best as possible, since it allows us to not only represent features of entities, but also represent their potentially complex relationships using graph edges, thus acting as an additional inductive bias. Graph data structures are useful in modelling various entities and networks, including news propagation which is what we are interested in. The model proposed in this paper performs with great accuracy even when trained only after limited amount of news spreading time, and seems to also age very well.